


Fintech · Trading analytics
Strike Money — design system and trading product UI
Overview
Strike Money helps short-term traders, long-term investors, and F&O traders make data-backed decisions in one place. The product surface is inherently dense: tables, charts, OI views, breadth indicators, and stock fundamentals compete for attention.
I partnered closely with the PM and cofounder to design the core product UI and author the Strike Design System, then stayed through ship. After customers were on the live product, we ran a focused redesign jump on Watchlist, Sentiment & Diffusion Indicators, and Stocks Overview. The available Figma frames document that post-launch work. Earlier versions are unavailable for a visual comparison.
Problem
Institutional-grade market tools are only useful if traders can orient fast. Without a shared visual system and clear primary flows, every module risks feeling like a separate tool — and the first session never reaches insight.
Constraints we designed against:
- High information density (live markets, multi-widget dashboards)
- Mixed user intents (intraday vs positional vs F&O)
- Need for engineering to ship consistently across many screens
- Post-launch learning: improve the monitoring surfaces people actually used, without boiling the ocean
Role & collaboration
As Freelance Senior Product Designer I owned:
- Product UI for Login, Dashboard, Watchlist, Sentiment & Diffusion, and Stocks Overview
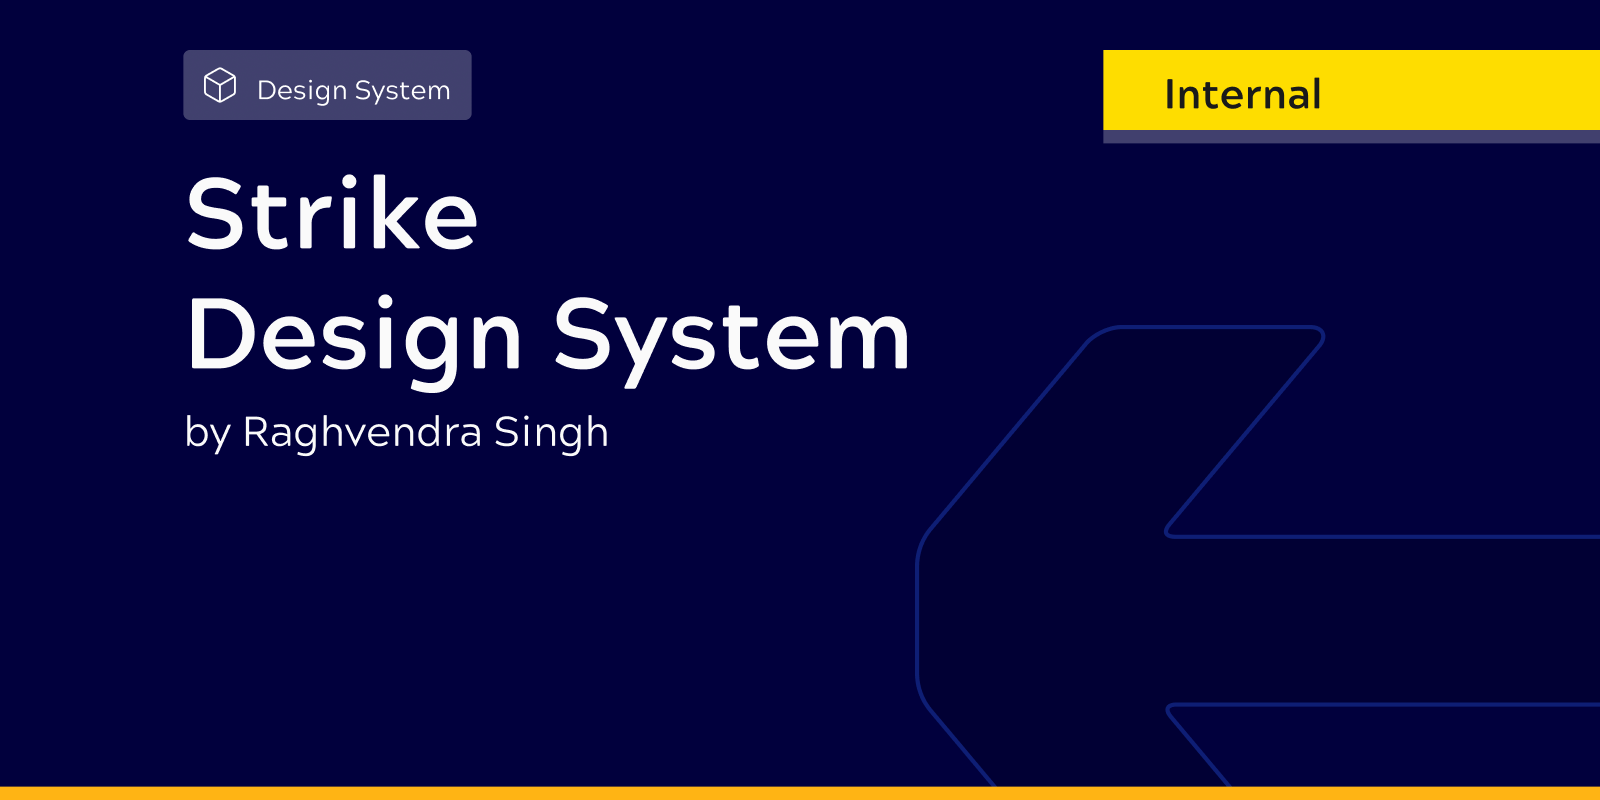
- Foundations and components in the Strike Design System (Internal)
- Interaction states for critical ops (auth recovery, watchlist manage, indicator expand/collapse)
I worked day-to-day with the PM and cofounder on problem framing, prioritisation, and what “good” meant for a trader’s session. Engineering implemented against the system and screen specs. Individual contribution = design decisions and UI system; product direction and shipping were shared.
Approach
- Align on trader jobs — get to market overview, manage symbols, read breadth/sentiment, open a stock.
- System first — tokens, type, and components so new analytics screens didn’t invent a new language.
- Ship a coherent v1 — Login + Dashboard as the spine; other modules on the same system.
- Learn from live use — redesign jump on Watchlist, Sentiment–Diffusion, and Stocks Overview where friction showed up after ship.
Design system
I authored Strike Design System as the single source for foundations and UI primitives consumed by the Client visual-design file (e.g. Navigation Panel instances on analytics screens).
Foundations
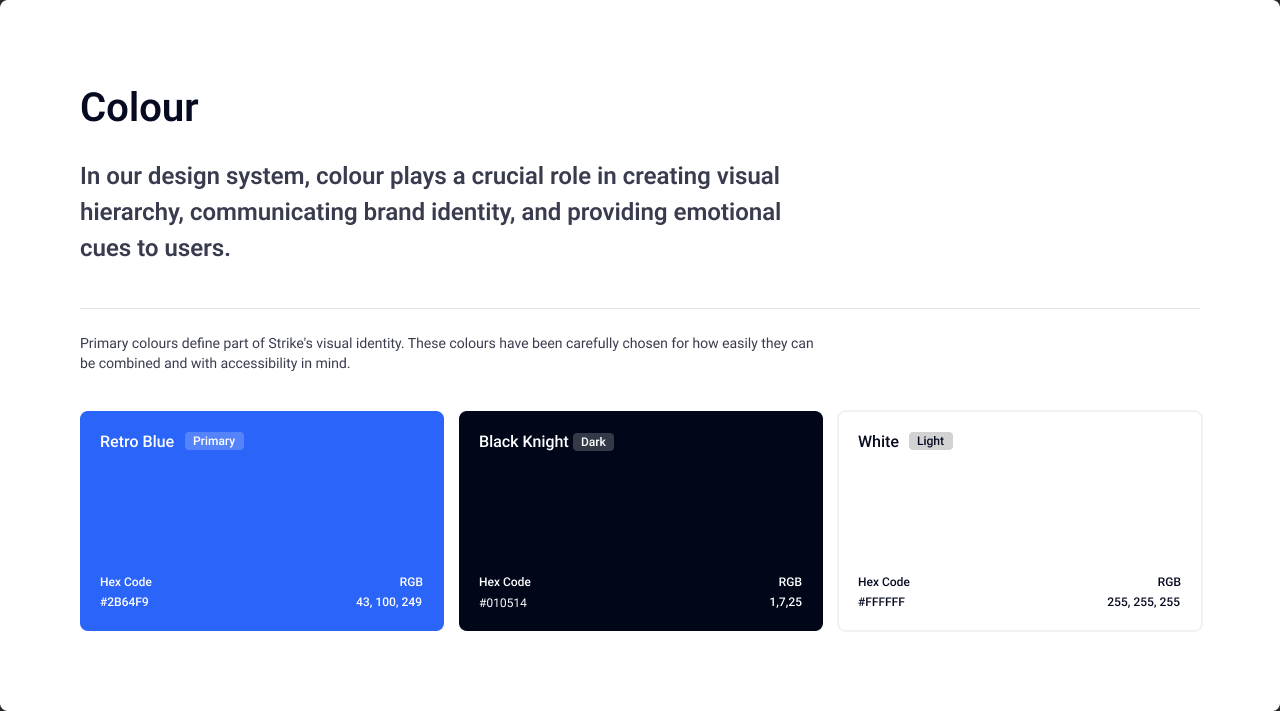
- Primary brand: Retro Blue
#2B64F9, Black Knight#010514, White#FFFFFF - Light/dark semantic tokens (text primary → tertiary, BG base / pods / hover, and related use cases)
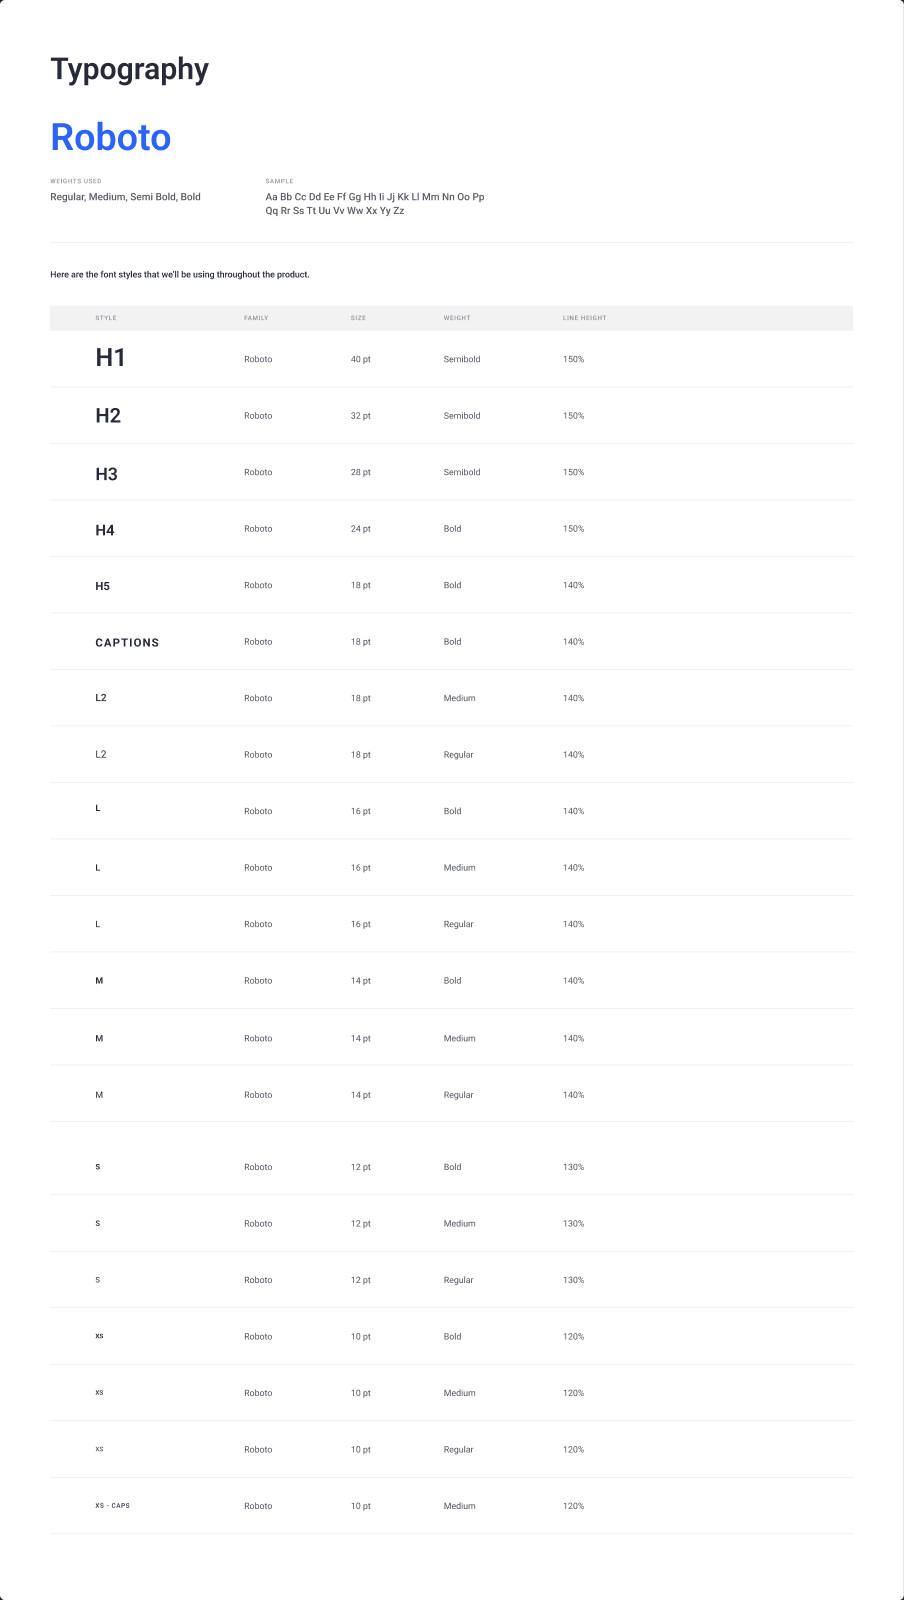
- Typography: Roboto scale from H1–H5 through L / M / S / XS (Regular, Medium, Semibold, Bold)
- Grid, icons, logos
Components & organisms
Buttons, inputs, cards, dropdowns, empty states, modals, tabs, tables, tags, snackbars, tooltips, avatars, badges; organisms including Navigation Panel, title bars, and graph rules.
Why it mattered
Dense chart/table UIs stay one product from Dashboard → Watchlist → Indicators → Stocks, and handoff stops reinventing spacing, colour, and controls per screen.
Product surfaces
1. Login / Sign up
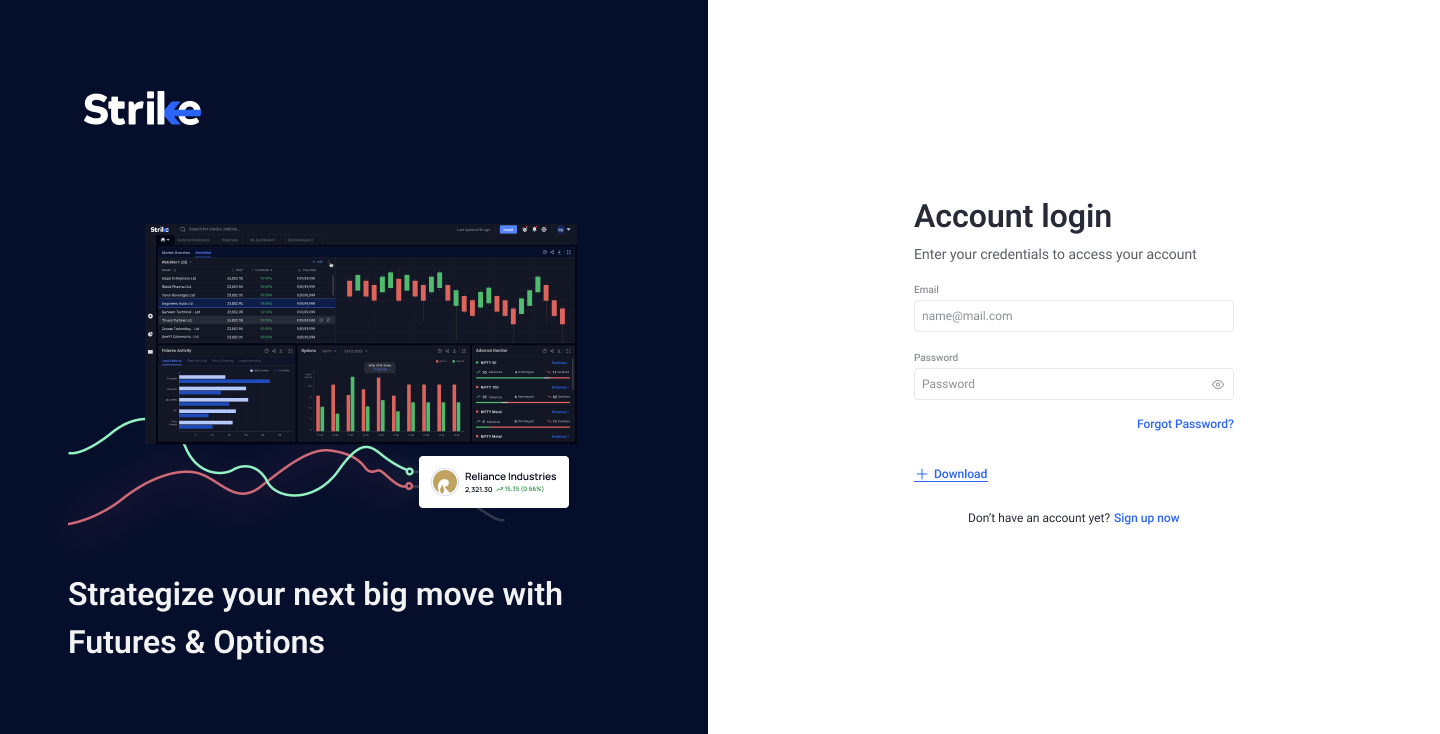
Decision: Split layout — product story and illustration on the left, credentials on the right — so auth time reinforces F&O value without blocking sign-in.
Designed: Default login, email/password typing and error states, password reveal, and a full reset-password path (OTP request, wait, verify success/failure, new password + validation). File notes called for a looping USP carousel (~5s) in the illustration area.
Tradeoff: Richer marketing at the gate vs a minimal form-only login.
2. Dashboard
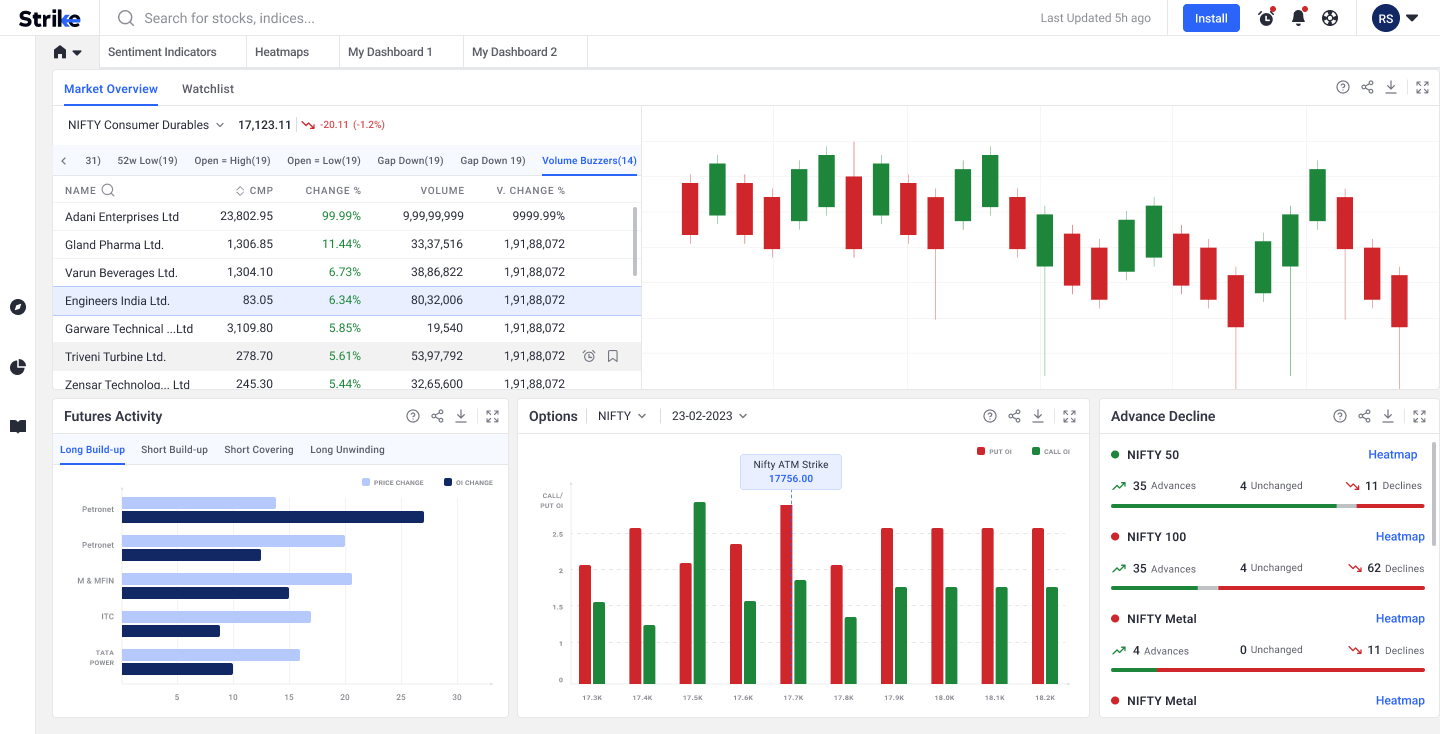
Decision: A composable home for power users — Market Overview table + chart, Futures Activity (build-up / covering tabs), Options OI, Advance Decline — with global search and expand states, including dark variants.
Tradeoff: Multi-widget density vs progressive disclosure; expansion keeps detail available without leaving home.
3. Watchlist (post-ship redesign jump)
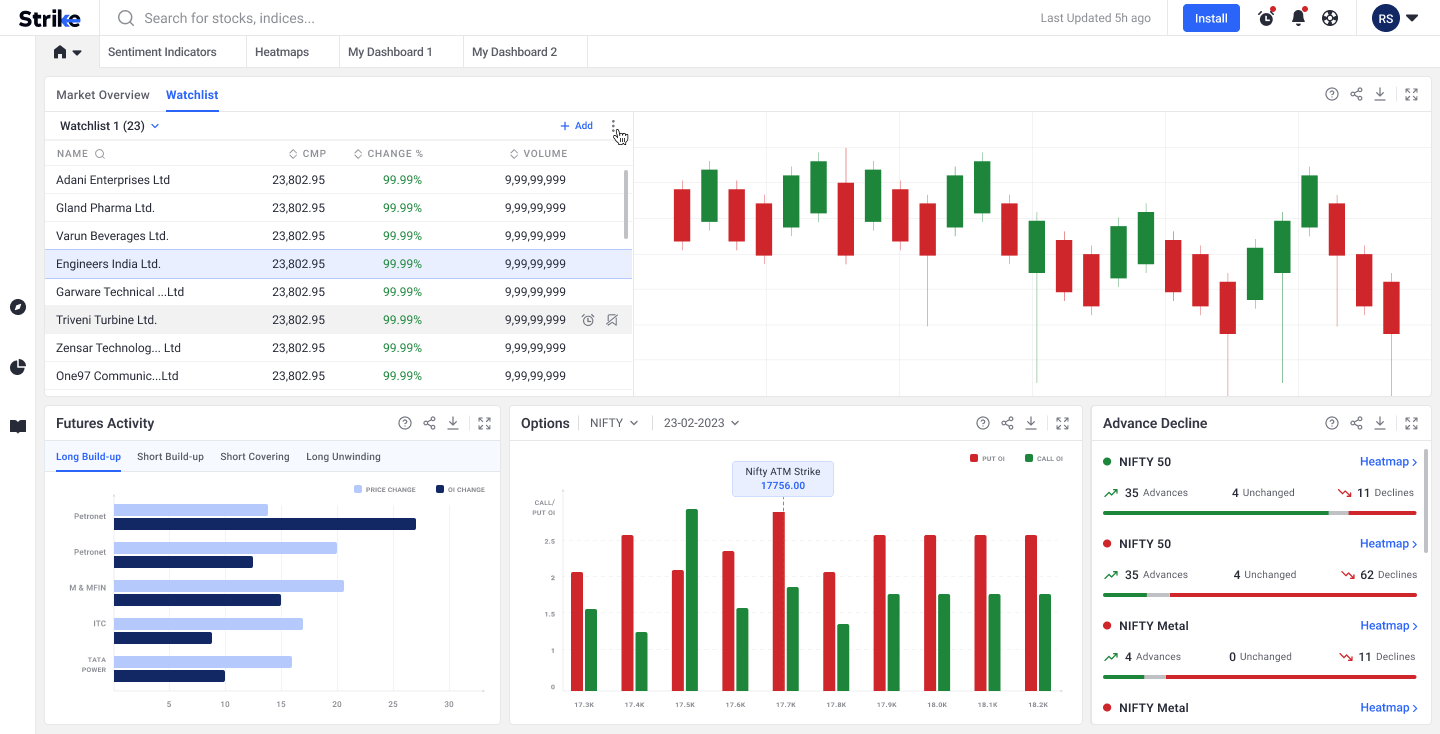
Decision: Treat watchlists as operational objects, not static lists.
Designed: Entry → add items → success → manage panel (move / copy / remove) → rename (focus, typing, apply).
Tradeoff: More states to design and ship vs fewer errors when traders reorganise symbols under time pressure.
4. Sentiment & Diffusion Indicators (post-ship redesign jump)
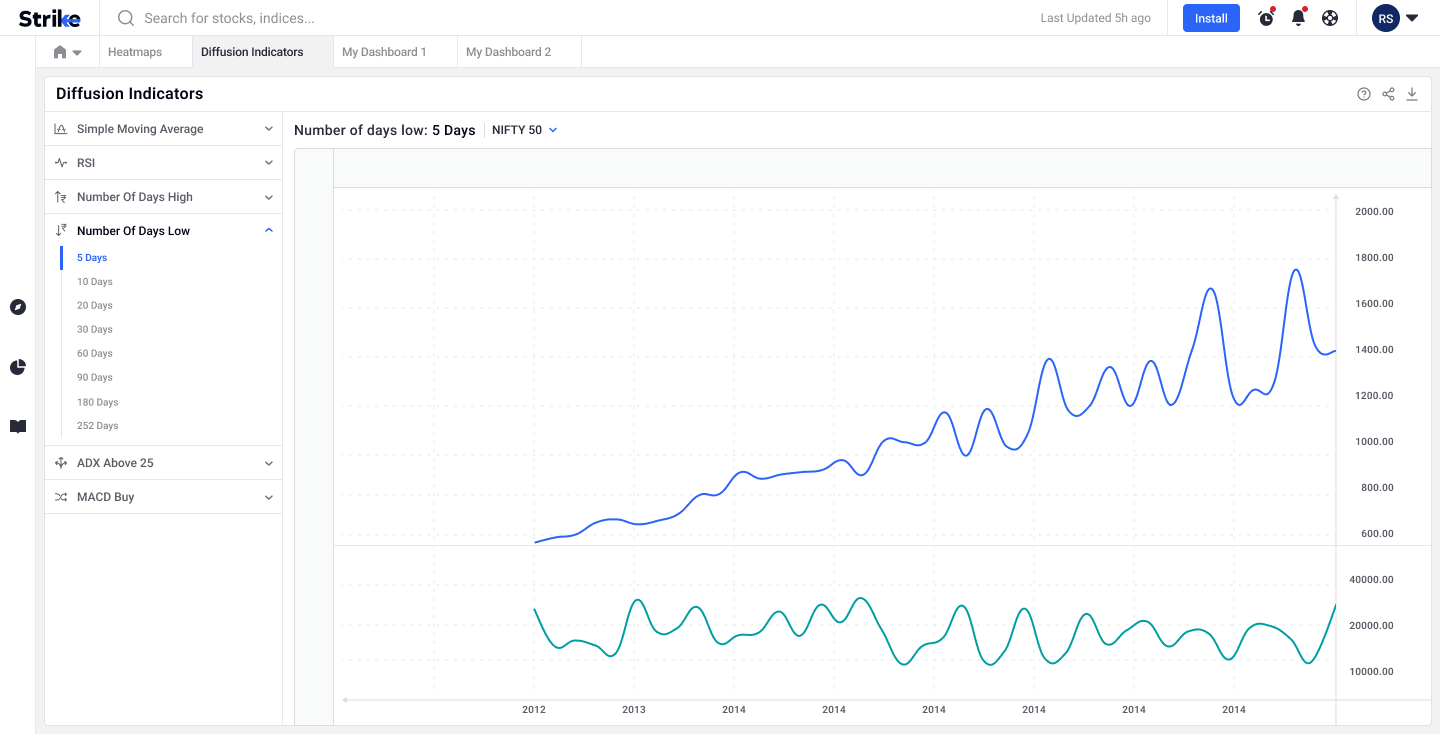
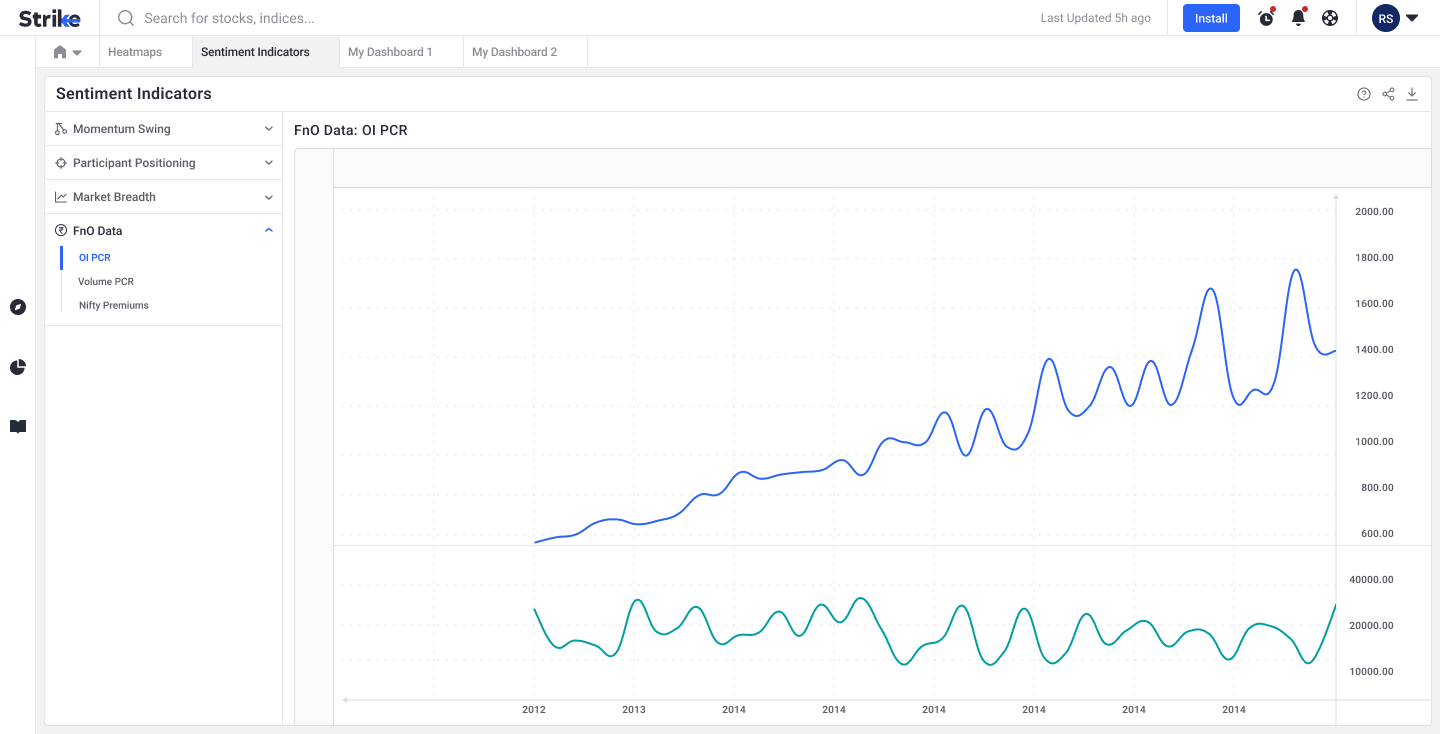
Decision: Dedicated light/dark surfaces for breadth and sentiment reading, with collapsed/expanded diffusion layouts. Later polish raised chart axis type size, darkened greys, and adjusted legend size/colour for long sessions.
Tradeoff: Session-length readability over decorative lightness.
5. Stocks | Overview (post-ship redesign jump)
Decision: Stock detail as a hub — overview with paths into related watchlist/info views and expanded shareholding / seasonality — not one endless fundamental scroll.
Tradeoff: Hub-and-spoke into charts/peers vs packing everything on one page.
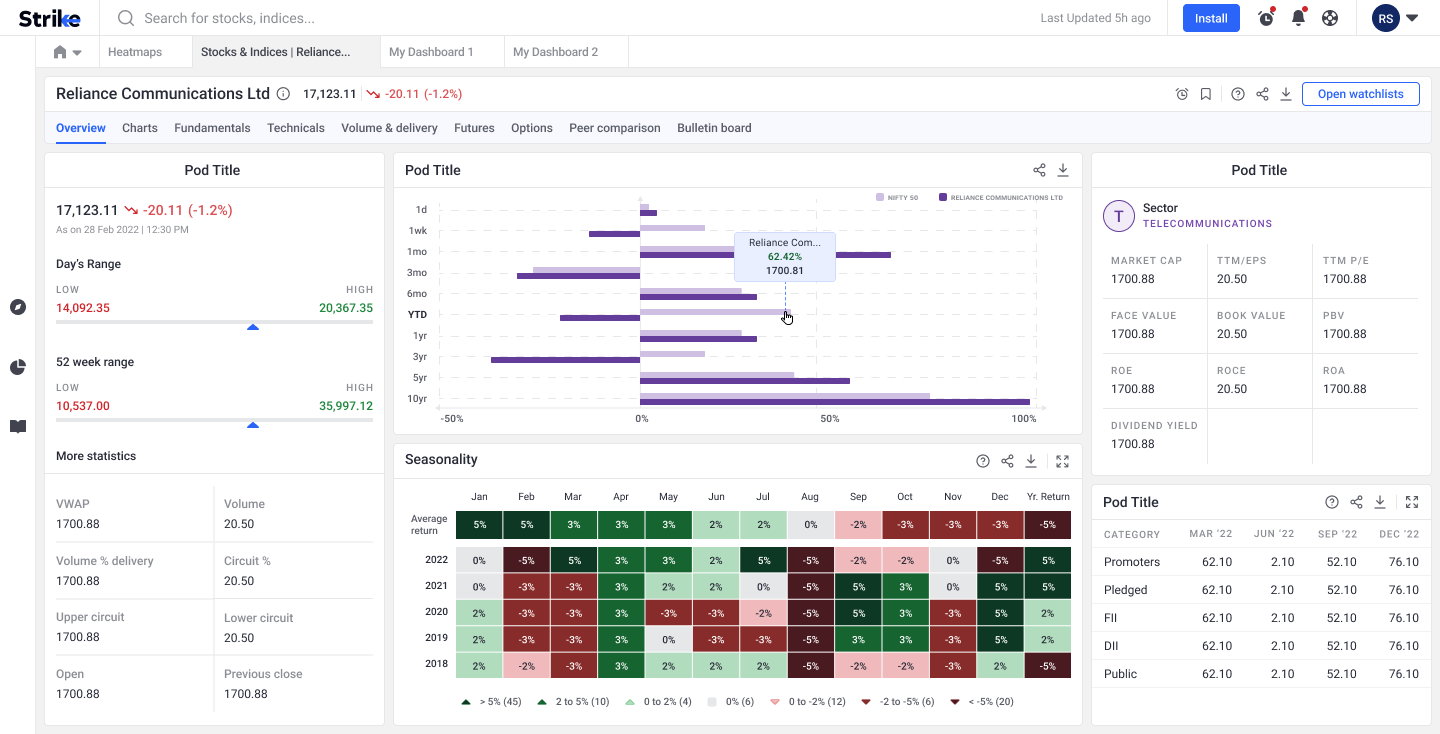
The redesign jump
We shipped one version to customers, then updated design once the product was live. The jump concentrated on Watchlist + Stocks Overview + Sentiment–Diffusion — the monitoring and stock workflows where post-launch use justified another pass. Login and Dashboard remain in the story as shipped collaboration, not as part of that same redesign arc. Post-jump Figma is what we have; v1 screens are not available for a visual before/after.
Outcome
- One visual language from auth → home → monitoring → stock detail
- A Figma system engineering could reuse across a growing analytics surface
- Post-launch jump aimed at real watchlist ops and indicator/stock reading
Live product: strike.money
Reflection
Shipping with the cofounder and PM first created a shared baseline; the redesign jump was earned by usage, not by polishing everything twice. The design system is what made that second pass affordable — new states and readability fixes stayed inside the same tokens and components.